
Figure 2.
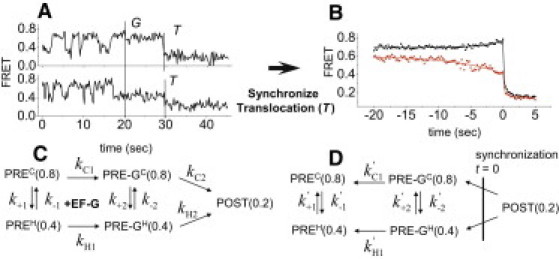
smFRET traces and reaction schemes for EF-G promoted translocation. (A) The smFRET recordings show transitions between PREC and PREH before EF-G injection (G) and translocation to POST (T) after EF-G injection. (B) Post-synchronized, averaged translocation traces of fluctuating complexes translocated from PREC (black) or PREH (red). (C) Forward and (D) time-reversed schemes of translocation. Numbers in parentheses are FRET values.