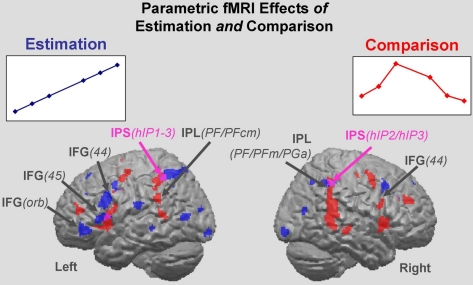
Figure 3.
Estimation and Comparison regions. Parametric effects for the Estimation of the numerosity of circles in target color (blue areas), and for the Comparison as manifest through RT (red areas). All effects are main effects over the six quantifiers. Estimation clusters: brain regions in which the BOLD signal intensity co-varies with the linearly increasing number of circles in target color (F-test). Comparison clusters: brain regions in which the BOLD signal intensity co-varies with RT – a reflection of processing difficulty. Regions commonly tapped by the Estimation and Comparison parameters are shown in purple (red plus blue). IPS, intraparietal sulcus; IFG, inferior frontal gyrus; IFG/orb, pars orbitalis of the IFG.

