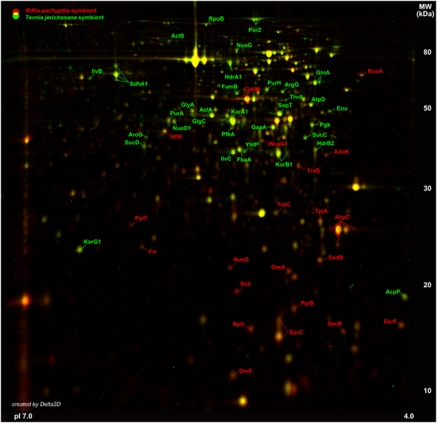
Figure 2.
Differences in intracellular symbiont metaproteomes. Representative master gel images for the Riftia symbiont fraction and the Tevnia symbiont fraction, respectively, were created with Delta 2D by average-fusion of three individual symbiont gel images (pI range 4–7) for each tube worm genus. These master gel images were colored (Riftia symbiont: red spots, Tevnia symbiont: green spots) and overlaid to visualize differences in the soluble symbiont proteomes in a dual-channel gel image. Yellow spots indicate similar protein spot volume values in both symbiont fractions. Proteins with an at least 1.5-fold change in spot volume with regard to the reference organism are labeled accordingly and were considered in this study (see also Figure 3 and Supplementary Table S4). Variations could mainly be identified for the sulfur oxidation pathway, carbon fixation and the response to oxidative stress.

