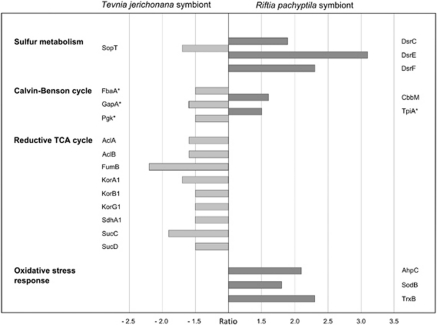
Figure 3.
Protein spot ratios. Differences in spot volume as detected on the dual-channel image (Figure 2) when comparing the soluble fractions of the Riftia symbiont and the Tevnia symbiont metaproteomes are indicated for relevant proteins of the sulfur and carbon metabolism as well as for proteins involved in the response to oxidative stress. Spot volumes (see Supplementary Table S4) are calculated as percentages (% vol) of the total proteomes on the respective 2D reference gels. The ratio (fold change) reflects the quotient of two corresponding spot volumes. Ratio threshold: 1.5-fold change compared with the reference organism; minimum spot volume: 0.1% vol. Positive ratio values (dark gray bars) mark a relatively higher spot volume for proteins on the Riftia symbiont gel, compared with the Tevnia symbiont. Negative ratios (light gray bars) indicate higher spot volumes on the Tevnia symbiont gel. See Supplementary Table S4 for protein functions. *Protein is also involved in organic carbon metabolism.

