Figure 3.
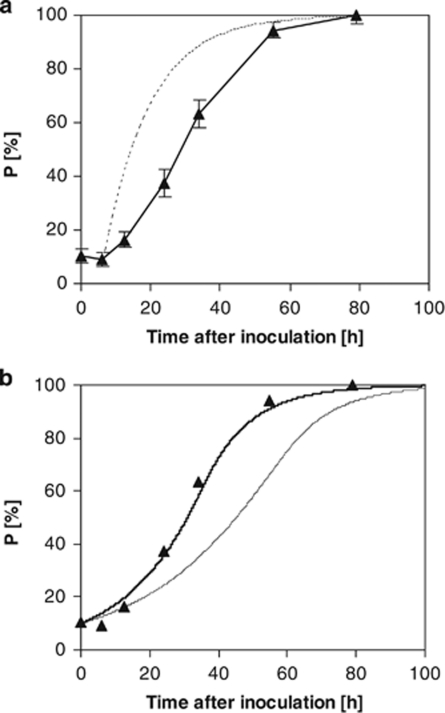
(a) Population dynamics C. heintzii (▴) in relation to cell number during competition for glucose with E. coli in a glucose-limited continuous culture at a dilution rate of 0.075 h−1 with a glucose feed of 50 mg carbon per litre at 30 °C. For comparison, the theoretical wash-in curve is shown assuming a lag phase of 7 h. (b) Prediction of competition for glucose for a mixed culture of C. heintzii (▴) and E. coli in a glucose-limited continuous culture at a dilution rate of 0.075 h−1. The fits for the different smin are shown, namely for smin=18.0 μg l−1 ( ) from Kovárová et al. (1996) and for smin=34.9 μg l−1 (—), a value obtained by parameter estimation.

