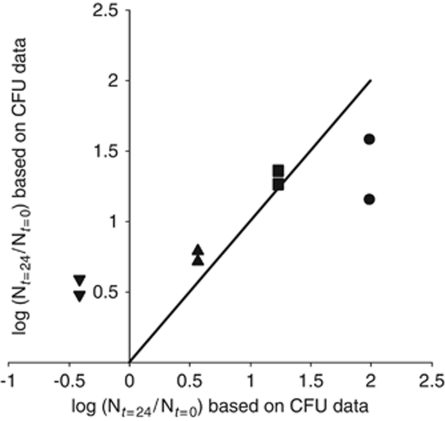
Figure 4.
Comparison of estimates for Nt=24/Nt=0, that is, fold increase in bacterial population sizes over 24 h, based on CFU data and GFP data. For the x values of each data point, we used the y axis values shown in Figure 1b. For the y values of each data point, we used the total area under all bars for each corresponding histogram shown in Figure 3. The symbols mark the inoculation density (CFU per leaf) at t=0: (•) 4.5 × 10³; (▪) 6.9 × 10⁴; (▴) 5.7 × 10⁵; and (▾) 1.2 × 10⁷, and correspond to the symbols used in Figure 1. If the CFU- and GFP-based estimates for one particular inoculation density were identical, the corresponding data point would fall on the line with slope 1. The deviations from this line at low and high inoculation densities are discussed in the text.

