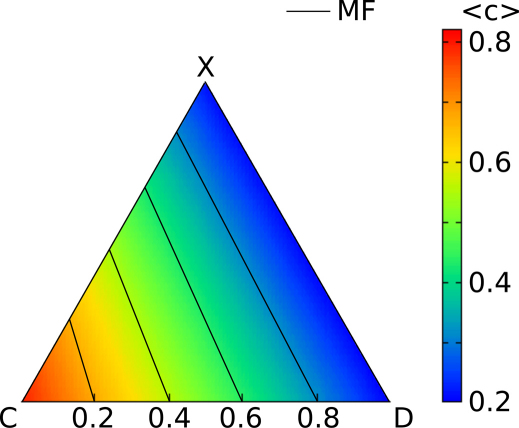
Figure 1. Dependence of the average level of cooperation on the density of strategists.
Density plot of 〈c〉, as a function of the fractions of the three strategies (mostly cooperators, C, mostly defectors, D, and moody conditional cooperators, X). The plot corresponds to a Barabási-Albert network of contacts (〈k〉 = 6), but the corresponding plot for an Erdös-Renyi graph or a regular lattice is indistinguishable from this one. The system is made up of N = 104 players and the rest of parameters, taken from Ref. 18, are: d = 0.38, a = 0.15, γ = 0.62, β = −0.1. The thin lines represent the mean-field estimations [c.f. Eq. (5)] for 〈c〉 = 0.32, 0.44, 0.56, 0.68. They very accurately match the contour lines of the density plot corresponding to those values of 〈c〉, thus proving that the same outcome is obtained in a complete graph (mean-field). Simulation results have been averaged over 200 realizations.

