
Figure 4. Payoff Distributions.
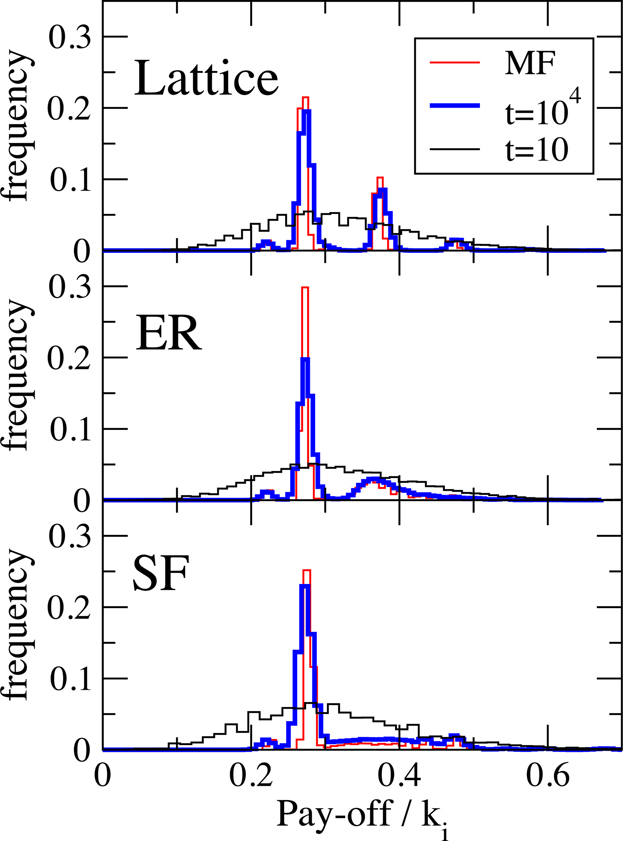
Distribution of the pay-off per neighbor in the stationary state for different network topologies: regular lattice (k = 8), Erdös Rényi (〈k〉 = 8) and Barabási-Albert network (〈k〉 = 8). Black and blue lines represent the results of numerical simulations for two values of time: t = 10 (black shallow curves) and t = 104 (blue, thick line curves) while red lines represent the theoretical estimations at t = 104, as obtained from Eq. (8). N = 104, ρD = 0.586, ρC = 0.053, and other parameters are as in Figure 1. The simulation results are averages over 103 realizations.