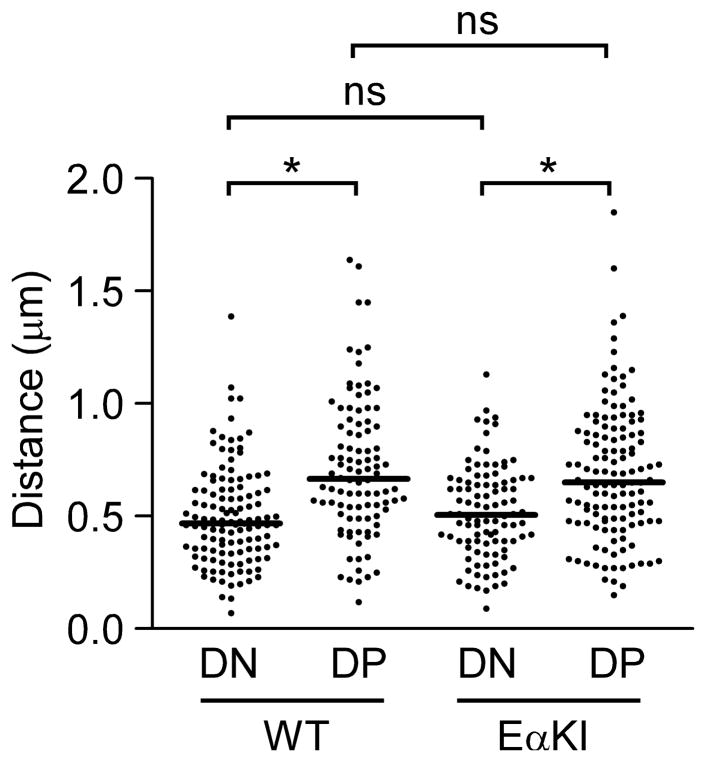
FIGURE 2.
Conformation of wild-type and EαKI alleles. 3D-FISH was performed using probes to the 5′ and 3′ ends of the Tcrb locus. Scatter plots display distances between centers of probe hybridization in Rag2−/− DN thymocytes (130 alleles from 3 slides), EαKI Rag2−/− DN thymocytes (90 alleles from 3 slides), DP thymocytes from Rag2−/− mice treated with an anti-CD3ε (90 alleles from 3 slides), and DP thymocytes from EαKI Rag2−/− mice treated with anti-CD3ε (130 alleles from 3 slides). Median values are indicated by horizontal lines. *, P<0.0001; ns, not statistically significant. Data were accumulated from two independent experiments for each cell type.

