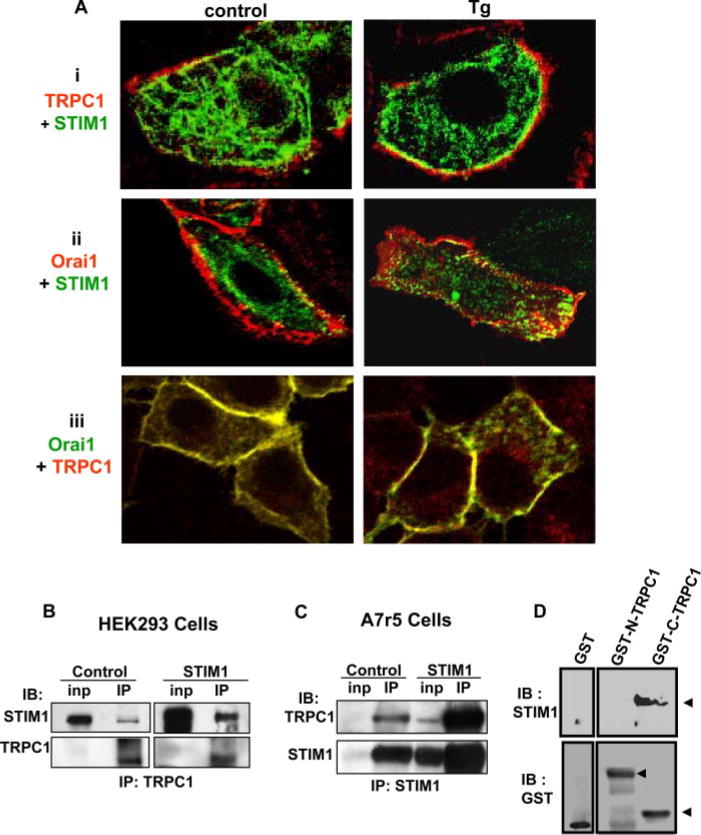
FIGURE 4. Co-localization of TRPC1, Orai1, and STIM1 in HSG cells.
A, localization of TRPC1 and STIM1 (red, FLAG-TRPC1; green, CFP-STIM1; yellow; overlap of the two signals) (i); Orai1 and STIM1 (red, Myc-Orai1; green, YFP-STIM1; yellow, overlap) (ii); Orai1 and TRPC1 (green, Myc-Orai1; red, FLAG-TRPC1; yellow, overlap) (iii) in resting and Tg-stimulated (3 min) HSG cells. Confocal imaging was used to detect protein localization (antibody concentrations and other details are given under “Experimental Procedures.”) TRPC1 was overexpressed, because the signal of the endogenous protein was relatively lower that those of expressed YFP STIM1 or Myc-Orai1; note that similar findings were obtained with HA-tagged or FLAG-tagged TRPC1 and CFP- or YFP-STIM1). B, co-immunoprecipitation of STIM1 (upper panel) with endogenous TRPC1 (lower panel) from lysates of HEK293 cells. C, co-immunoprecipitation of TRPC1 (upper panel) with STIM1 (lower panel) from lysates of A7r5 cells. In each case cells were either transfected with empty vector (control) or with STIM1-encoding vector (STIM1). “Inp” indicates input levels of proteins in lysate, and “IP” indicates immunoprecipitated proteins. TRPC1 in the IP fraction was not changed by Tg stimulation (data not shown). Antibodies for IP and immuno-blotting (IB) are indicated. 2 mg of cell lysates was used for IP. D, pulldown of STIM1 from HSG cells lysates by GST fusion protein of the C and N termini of TRPC1 (GST-C-TRPC1 and GST-N-TRPC1, respectively) is shown in the upper blot. “GST” indicates the control GST protein alone. The lower blots show the amount of the fusion proteins or control GST protein used.

