
Figure 2.
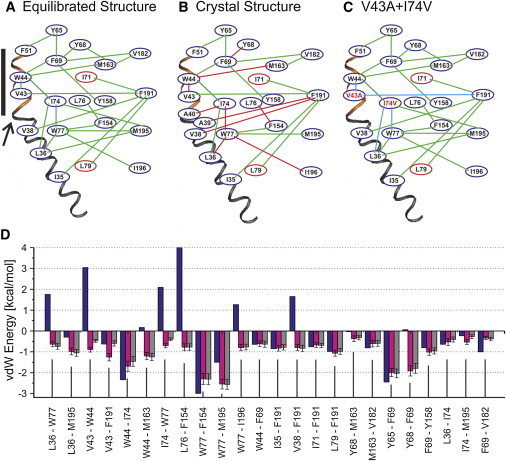
Map of the vdW networks extending from the parahelix through TM1. (A) Network determined from the trajectories of production stage MD simulations for the wild-type channel. Adjacent residues were included in the network if a portion of the time-averaged vdW energy was <−0.5 kcal/mol. (Connections of blue ovals by green lines) Intrasubunit interactions; (connections of red ovals to blue ovals by green lines) intersubunit interactions. (B) Network determined from the completed but unequilibrated Cx26 crystal structure. (Red lines) These connected residues in the vdW network depict residues that lie within 3.0 Å in the crystal structure but whose interactions have positive Lennard-Jones potentials. (Green lines) These connecting residues have vdW energies <−0.5 kcal/mol. (C) The network determined for the double mutation V43A+I74V from the trajectories of production stage MD simulations. (Blue line) Interactions that are substantially weakened from wild-type Cx26 (panel A). (D) vdW energies of specified interactions calculated in CHARMM from Lennard-Jones potentials: (blue) crystal structure; (magenta) equilibrated structures; (gray) double mutant. (Solid bar) Position of the parahelix; (arrow) TM1/E1 bend.