
Figure 1.
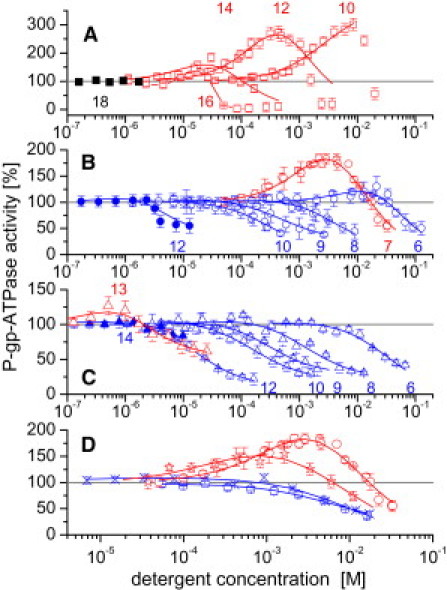
P-gp-ATPase activity measured in plasma membrane vesicles of NIH-MDR1-G185 cells as a function of the detergent concentration for Cm-TAC (red open and black solid squares), m = 10–18 with increments of 2 (A); Cm-gluc (red open, blue open, and blue solid circles), m = 6–10, 12 (B); Cm-malt (red open, blue open, and blue solid triangles), m = 6, 8–10, and 12–14 (C); and detergents with different headgroups and an anchor length of seven carbon atoms: C7-gluc (red open circles), Anameg-7 (red stars), Cyglu-3 (blue exes), and C7-Tgluc (blue pentagons) (D). Measurements were performed at pH 7.0 and T = 37°C. Detergent concentrations remained always below 0.5 × CMC. Red symbols indicate compounds with an optimal ratio and blue symbols indicate analogs for which the free-energy ratio, , is higher or lower. The latter compounds downregulate or inhibit the P-gp-ATPase. The analogs with the longest alkyl chains showed only a reduced (blue solid circles and blue solid triangles) or no interaction (black solid squares). Data are expressed as the average of two measurements. Solid lines represent fits to data using Eq. 1. Gray horizontal line represents basal P-gp-ATPase activity taken as 100% (ln100 = 4.605).