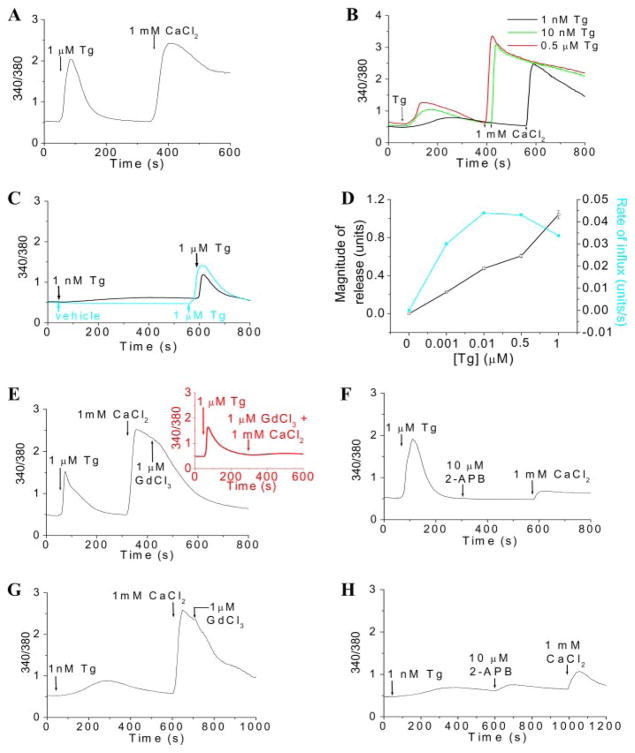
FIGURE 1. Activation of SOCE by incomplete depletion of ER Ca2+stores.
A and B, Tg-induced intracellular Ca2+release and Ca2+entry in HSG cells. The various [Tg] used for activation of SOCE are indicated in the figure. C, Ca2+release induced by 1 μM Tg in control cells (blue trace) and in cells previously treated with 1 nM Tg (black trace), indicating the extent of depletion of ER by 1 nM Tg. D, dose-response curve showing the effect of [Tg] on Ca2+release (units; squares) and the rate of Ca2+influx (units/s; circles). Data were plotted as mean ± S.E. from three or four separate experiments and expressed in 340/380 fluorescence ratio units; error bars were within the size of the symbols. Ca2+ influxes induced by 1 μM and 1 nM Tg were blocked by 1 μM GdCl3 (E and G, respectively) and 10 μM 2-APB (F and H, respectively). A trace showing the inhibition of Ca2+influx induced by 1 μM Tg by 1 μM GdCl3 added before 1 mM CaCl2 is shown as an inset (similar results were seen with 1 nM Tg; data not shown) in E. [Ca2+]i was measured in Fura-2-loaded cells and is expressed as 340/380 ratio. Each analog plot showing Ca2+ release and Ca2+ entry is representative of at least four experiments, each trace showing the average from at least 50 cells.

