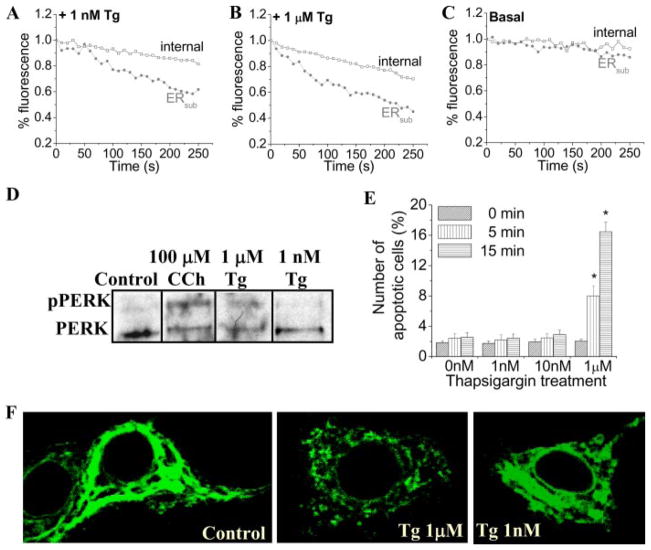
FIGURE 6. Tg-stimulated depletion of ER Ca2+.
[Ca2+] in internal (squares) and subplasma membrane ER (ERsub; circles) calcium stores in cells treated with 1 nM (A) or 1 μM Tg (B) and control cells (C) was measured using imaging of Mag-Fluo4 fluorescence. Confocal microscopy (details are given under “Experimental Procedures”) was used to determine fluorescence changes. Fluorescence was determined in demarcated areas in the plasma membrane and internal regions (areas not shown). Traces shown are averages from at least 6 – 8 cells and represent similar data obtained from three separate experiments. D, detection of phosphorylated PERK (pPERK) in lysates of HSG cells treated with 100 μM CCh, 1 μM Tg, and 1 nM Tg by Western blotting using phospho-PERK antibody (1:1000 dilution). E, the percentage of apoptotic cells detected using the Vybrant staining assay in control HSG cells and cells treated with 1 nM, 10 nM, and 1 μM thapsigargin for 0, 5, and 15 min. Data are plotted as mean ± S.E., where an asterisk indicates p < 0.05. F, distribution of STIM1 in control HSG cells and following stimulation with 1 μM and 1 nM Tg. STIM1 was detected using the mouse anti-STIM1 antibody (1:100 dilution) and the fluorescein isothiocyanate-conjugated anti-mouse secondary antibody (1:100 dilution).

