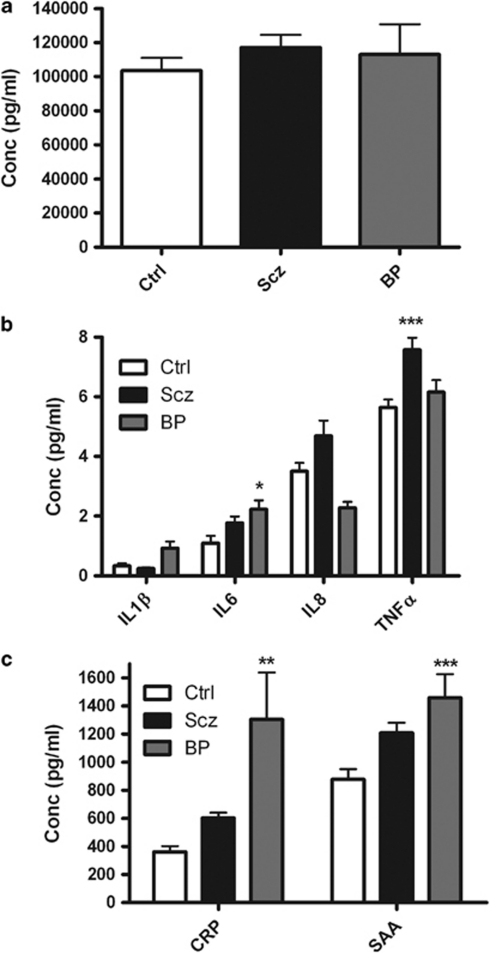
Figure 1.
Shown is a graph of plasma (a) cortisol, (b) cytokine and (c) acute phase protein levels in healthy controls (Ctrl), schizophrenia (Scz) and bipolar (BP) patients measured using enzyme-linked immunosorbent assay. Data shown are expressed as mean±s.e.m. Statistical differences between groups were determined using ANOVA. *P<0.05, **P<0.01, ***P<0.001 vs Ctrl. CRP, plasma C-reactive protein; SAA, serum amyloid A.

