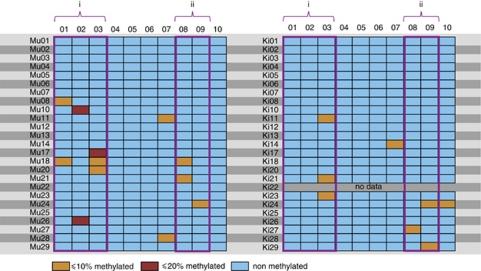
Figure 1.
Degree of methylation per individual and CpG site. Each line represents the analyzed fraction of the glucocorticoid receptor gene of a woman (Mu) and her child (Ki). The rows correspond to individual CpG sites. The degree of methylation for each individual CpG site, that is, the number of clones containing methylation in the particular site divided by the total number of sequenced clones, is colour-coded. In the case of one child we could not obtain a blood sample as indicated by ‘no data'. (i) Putative NGFI-A-binding site; (ii) Known NGFI-A-binding site.

