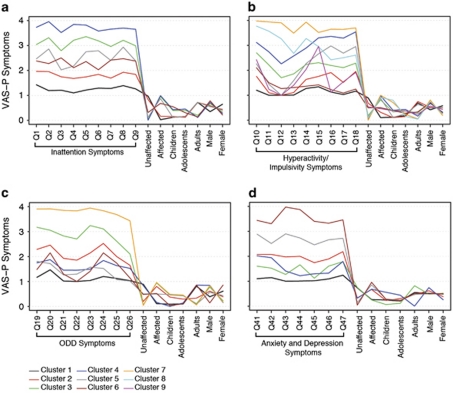
Figure 1.
Profile plots derived using latent class cluster analysis applied to attention-deficit and hyperactivity disorder symptoms as measured by the Vanderbilt Assessment Scale for Parents (VAS-P) questionnaire. For each domain, VAS-P symptoms profiles within clusters are shown in a scale from 1 to 4 (1=never, 2=occasionally, 3=often and 4=very often). Demographic characteristics for each cluster are shown in a scale from 0 to 1, representing the proportion of individuals from the population with such characteristics. (a) Inattention (Q1–Q9): Q1: careless, inattentive; Q2: sustains attention poorly; Q3: appears to not listen; Q4: poor follow through; Q5: disorganized; Q6: avoids/dislikes sustained mental effort; Q7: loses needed objects; Q8: easily distracted; and Q9: often forgetful. (b) Hyperactivity/impulsivity items ( Q10–Q18): Q10: fidgets or squirms; Q11: cannot stay seated; Q12 restless; Q13: loud; noisy; Q14: always ‘on the go' Q15: talks excessively; Q16: blurts out; Q17: impatient; and Q18: intrusive. (c) Oppositional defiant disorder (ODD; Q19–Q26): Q19: loses temper; Q20: argues with adults; Q21: defies adults' rules; Q22: annoys others; Q23: shifts blames to others; Q24: touchy; Q25: angry/resentful; and Q26: vindictive. (d) Anxiety and depression (Q41–Q47): Q41: fearful, worried; Q42: fear of making mistakes; Q43: feels useless; Q44: blames self; Q45; feels unloved; Q46: sad; and Q47: embarrassed.

