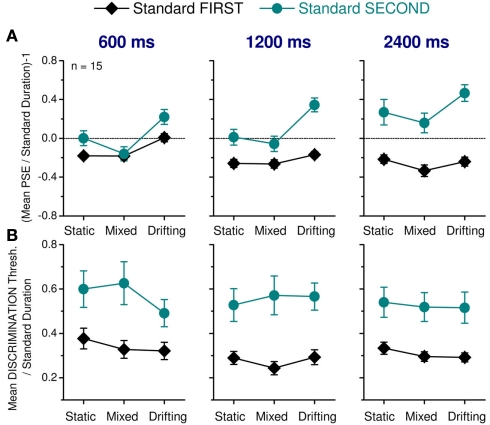
Figure 3.
Effect of presentation order on apparent duration and discrimination thresholds. (A) Proportion changes in perceived duration [(PSE/standard duration) − 1] averaged across 15 subjects for three standard durations (different panels) and three stimulus types (different symbols and colors). Dashed lines represent the actual standard duration. Error bars indicate ±1 SEM. (B) Mean discrimination threshold (divided by standard duration) for the same subjects and conditions as in (A).

