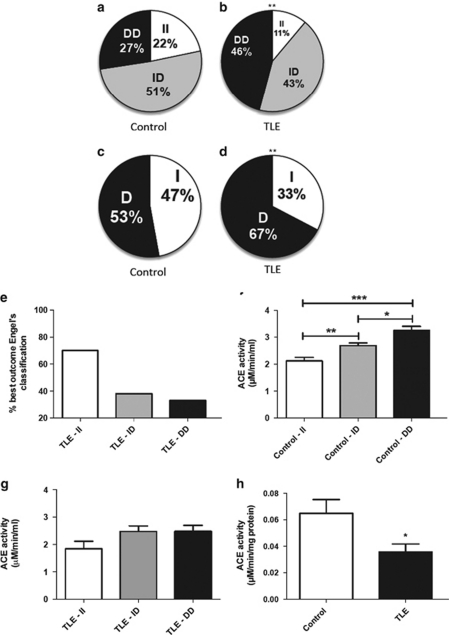
Figure 1.
ACE activity and TLE. (a, b) Distributions of the I/D ACE polymorphism in the control and TLE group (control n=368; TLE n=72). (c, d) Allele frequencies. (e) Percentage of class 1A (best) outcome (Engel's classification7) depending on genotype. (f, g) Mean (±s.e.m.) soluble ACE activity according to I/D distribution in the control group (n=127) and in patients with TLE (n=43). (h) Hippocampal tissue ACE activity. *P< 0.05, **P<0.01, ***P<0.001.

