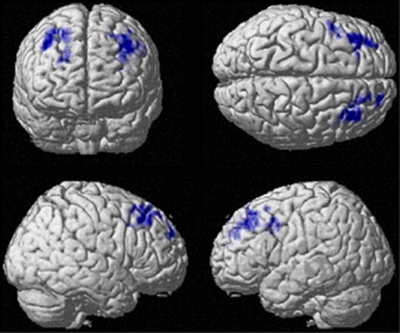
Figure 2.
Three-dimensional surface images showing areas of decreased perfusion in the prefrontal cortex with elevated WHtR at P<0.05. Cortical surface views demonstrate decreased regional cerebral blood flow in Brodmann areas 8, 9, 10 in players with a high WHtR at P< 0.05, family-wise error (FWE). Significant decreases are in blue. No increases were observed.

