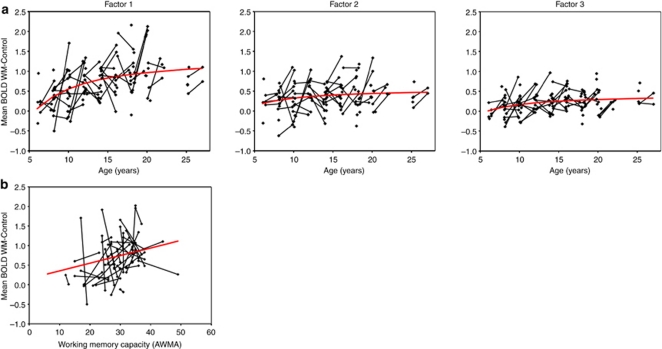
Figure 2.
(a): Scatterplot of the mean blood-oxygen level dependent (BOLD) working memory (WM)–control values plotted against age for all three factors. Black lines connect repeated measures for individuals who participated in both round 1 and 2. Red lines represent the mean predicted BOLD signal as a function of age, as obtained from the mixed-model analysis using the inverse of age as a fixed effect. (b) Scatterplot of the mean BOLD WM–control values of Factor 1 against Visuospatial WM (VSWM) capacity. Black lines connect repeated measures. The red line represents the mean-predicted BOLD signal for each age group, as obtained from the mixed-model analysis using the inverse of age as a factor.

