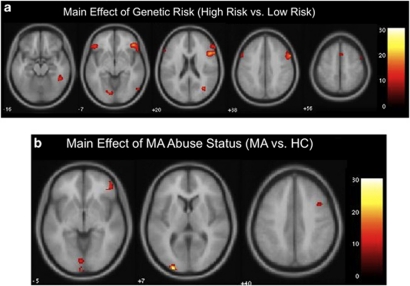
Figure 2.
Statistical maps overlaid onto a standard structural template provided by SPM5. (a) Regions showing a main effect of genetic risk (low vs high) in activation associated with observation of faces. Regions included occipital cortex, fusiform and supramarginal gyri, and ventrolateral, dorsolateral and dorsomedial prefrontal cortex (see Table 3). (b) Regions showing a main effect of MA abuse status (MA vs HC) in activation associated with observation of faces. Regions included occipital cortex and right ventrolateral and dorsolateral prefrontal cortex (see Table 3). HC, healthy control; MA, methamphetamine-dependent; SPM, statistical parametric mapping.

