Figure.
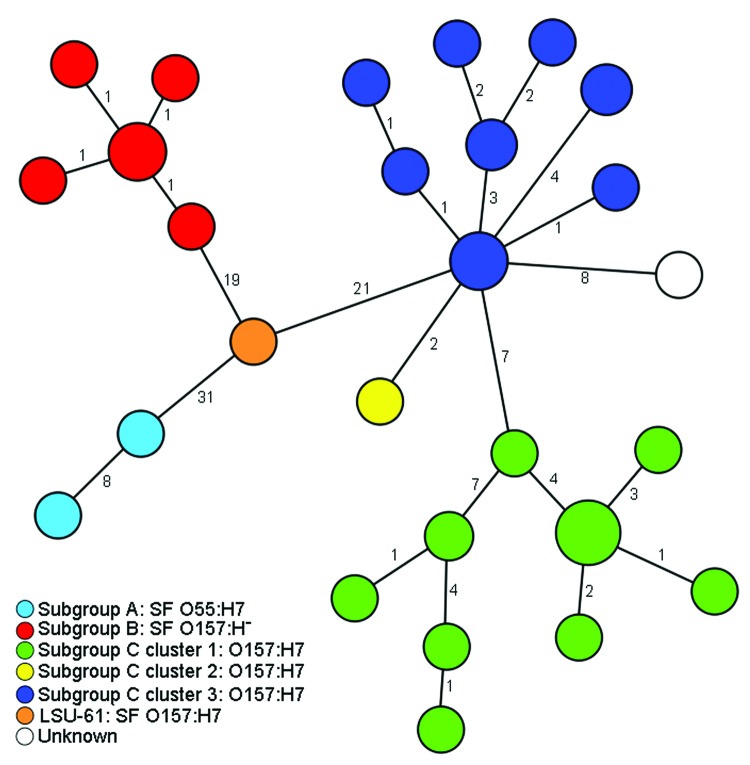
Minimum-spanning tree based on single-nucleotide polymorphism (SNP) genotypes illustrating the phylogeny of 50 enterohemorrhagic Escherichia coli O157:H7/H– and O55:H7 isolates and the intermediate position of strain LSU-61 during the evolution of O157. Each node represents a unique SNP genotype. The size of each node is proportional to the number of isolates per SNP genotype based on sequence analysis of 51,041 bp comprising 92 partial open reading frames. Numbers on lines between nodes represent distances between the nodes, i.e., the number of SNPs. The node size is proportional to the number of strains sharing the same genotype. Strains are colored according to their classification into subgroups and clusters based on information from Saikh and Tarr (11) and Leopold et al. (12). Strain LSU-61 represents a potential intermediate interlinking all 3 subgroups. SF, sorbitol fermenting.

