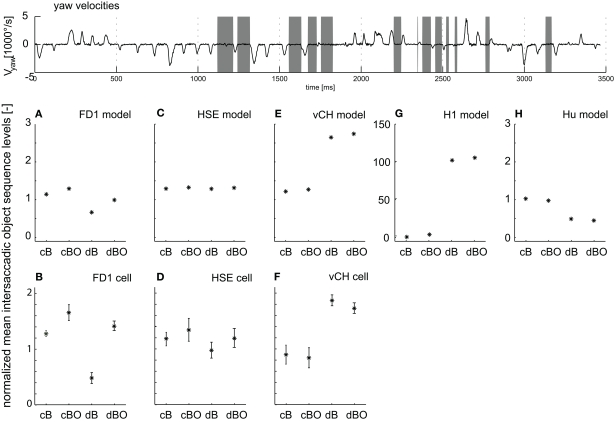
Figure 6.
Intersaccadic response levels. The angular yaw velocity of the head plotted against time for the naturalistic flight sequence used for parameter optimization (top trace). Intersaccadic intervals with an object in the receptive field of the FD1 cell are marked by gray bars. Intersaccadic responses of model cells (middle diagrams) and biological cells (bottom diagrams) averaged over these intersaccadic intervals for all environmental conditions. The responses are normalized to the mean intersaccadic responses determined for the environmental condition with close background and without objects (cB). (A, B) FD1, (C, D) HSE, (E, F) vCH, (G) H1, and (H) Hu. Error bars shown for experimental data represent standard deviations across cells; experimental details are in Liang et al. (2012). Note: The experimental HS responses were not only taken from HSE, but—since the responses were not systematically different under the stimulus conditions tested—also from HSS and HSN; details are given in Liang et al. (2012).

