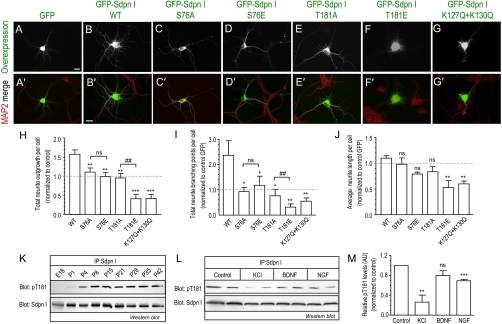
Fig. 6.
Syndapin I F-BAR phosphosites mutants alter neurite development. (A–G) Hippocampal neurons were transfected at DIV4 with GFP- syndapin I FL-WT and mutants and processed for immunofluorescence at DIV6. Anti-MAP2 staining shows neuronal morphology and the merged images with overexpression are shown in A′–G′. Images are representative of at least three independent experiments. Scale bar, 50 μm. (H–J) Quantitative analysis of the morphological effects per neuron transfected with GFP alone or GFP syndapin I phosphomutants for (H) total neurite outgrowth from each cell body, (I) total neurite branching points, and (J) average length of neurite outgrowth from the cell body. Relative mean values (± SEM) for H–J are normalized and expressed as a ratio to control GFP (dashed line) transfected neurons from at least three independent experiments. Total of 45–80 neurons for each condition were analyzed. One-way ANOVA was applied: ∗∗ ∗ P < 0.0001, ∗∗ P < 0.001, ∗ P < 0.05, ns = non-significant against WT, ##P < 0.001 against A mutants. (K–M) Western blot analyses of physiological changes to phospho-T181 (pT181) levels with total syndapin I as protein level control (Sdpn I). (K) pT181 in syndapin I immunoprecipitated (IP) from total rat brain lysates of different aged rats. The amount of total brain lysates from the different aged rats used for syndapin I IP were normalized to the relative increasing total syndapin I protein expression (Fig. S6B) so that total syndapin I protein was equal. (L) pT181 changes in syndapin I IP from CGN at DIV10 stimulated for 2 h with either 80 mM KCl, 100 ng/mL of brain-derived neurotrophic factor (BDNF) or nerve growth factor (NGF). (M) Quantitation of stimulation-dependent changes to pT181 phosphorylation from M using densitometry analysis. pT181 levels were normalized to total syndapin I protein and expressed as a relative value to control (nonstimulated) samples. Duplicate samples from n = 3 ± SEM, Student’s t test applied between control and each stimulation ∗∗ P < 0.01, ∗∗ ∗ P < 0.001. All blots are representative of three independent experiments.

