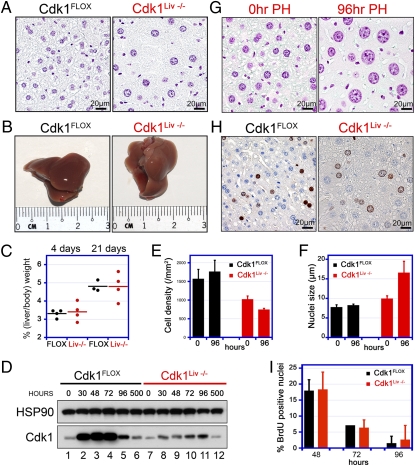
Fig. 2.
Liver-specific knockout of Cdk1. (A) Liver sections from Cdk1Liv−/− and control mice were stained with Feulgen to visualize their nuclei. Even though the overall liver size was similar, Cdk1-knockout livers contained fewer hepatocytes with enlarged nuclei. (B and C) To analyze the regenerative potential and S phase entry in Cdk1-knockout livers, 70% of the liver mass was removed by PH. Animals were euthanized 4 or 21 d later, and the ratio of liver to body weight was determined. Each dot in the chart represents an individual PH experiment, and mean values are depicted by the black or red lines. Cdk1Liv−/− livers regenerated the lost mass within 3 wk, comparable to controls. (D) To confirm Cdk1 knockout, Western blots with Cdk1 antibodies were performed at different times after PH in control and Cdk1Liv−/− liver extracts. Cdk1 expression detected in knockout livers is due to liver cells other than hepatocytes. (E–G) Cdk1Liv−/− display a decreased hepatocyte density compared with controls and the difference is exacerbated by 96 h after PH (E). Cdk1Liv−/− hepatocytes have enlarged nuclei that become even bigger after PH (F and G). (H and I) Regenerating livers were pulse-labeled with BrdU at 48 (H), 72, and 96 h after PH. BrdU incorporation was detected by immunohistochemical staining of liver sections (H) and quantified with a custom developed image analysis software (I). Data were obtained from n = 3 animals in E, F, and I and are represented as mean ± SD. Black and red bars indicate Cdk1FLOX and Cdk1Liv−/− livers, respectively.

