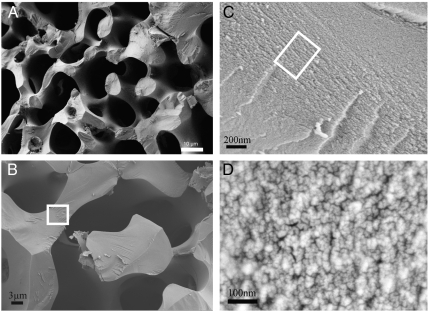
Fig. 1.
Fracture surfaces of a sea urchin spine shown at different magnifications under SEM (A)–(D). The spine was fractured perpendicular to its growth direction which corresponds to the crystallographic c-axis. Note: (C) is area bounded by white box in (B) and (D) is area bounded by white box in (C)

