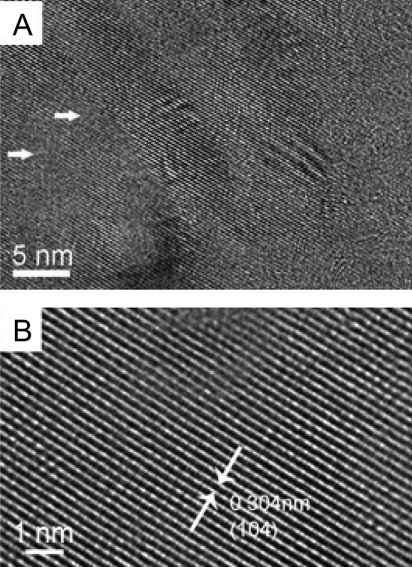
Fig. 3.
HRTEM of the microstructure of the sea urchin spine (A) A microtomed section of sea urchin spine imaged by HRTEM (The white arrows show the defect regions around the lattice fringes) (B) Higher magnification zoom showing the lattice fringes (white arrows depict the spacing between the start and end of fringe)

