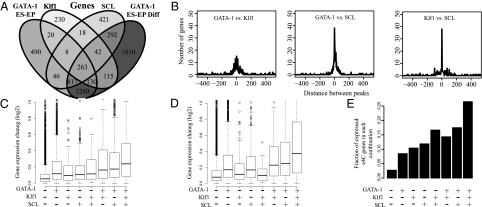
Fig. 1.
GATA-1, SCL, and Klf1 co-occupy many genes and bind in close proximity to each other. (A) Using occupancy maps derived from ChIP-Seq analysis of GATA-1 in proliferating and differentiating ES-EP along with SCL (14) and Klf1 (15) occupancy maps in FL-EP, we determined what genes were occupied by each factor. Occupancy was defined as a factor binding within −20 kb of TSS through +10 kb of TES of a given gene. A four-set Venn diagram is displayed, comparing the number of genes occupied by each factor. (B) The distance between bound sites of each factor was calculated for genes that are occupied by SCL, Klf1, and GATA-1 (in proliferating and/or differentiating cells). (C and D) Boxplots show the relative gene expression changes that occur during the differentiation of ES-EP (C) (20) or MEL cells (D) (20) for genes occupied by the indicated combination of factors. (E) The fraction of genes with the indicated occupancy of the three erythroid factors that were found to be expressed and form transcription factories with either α- or β-globin loci in erythroid cells as identified in a recent study (26).

