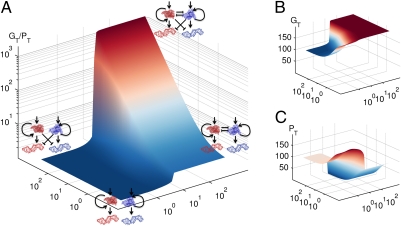
Fig. 4.
Mathematical model demonstrating the synergistic effect of repressing both the upstream activator and its downstream targets during lineage specification. (A) We determined the equilibrium expression-level ratio of GATA-1 targets/PU.1 targets (GT/PT, on the z axis using logarithmic scale) following a transient stimulation of GATA-1 for different combinations of the parameter values that independently modulate the mutual inhibition between GATA-1 and PU.1 (right corner, x axis) and inhibition of the other's downstream targets (left corner, y axis) from the base network topology represented in the bottom center corner (all other parameter values are constant and tabulated in SI Materials and Methods). The top center corner represents simultaneous high-level mutual inhibition and repression of the downstream targets. (B and C) GATA-1 target (GT) and PU.1 target (PT) gene expression levels, respectively, used to compute the GT/PT ratio. The highest GT/PT ratio observed in the top center corner of A is due to sustained elevated GT concentration with decreased PT concentration relative to all other corners.

