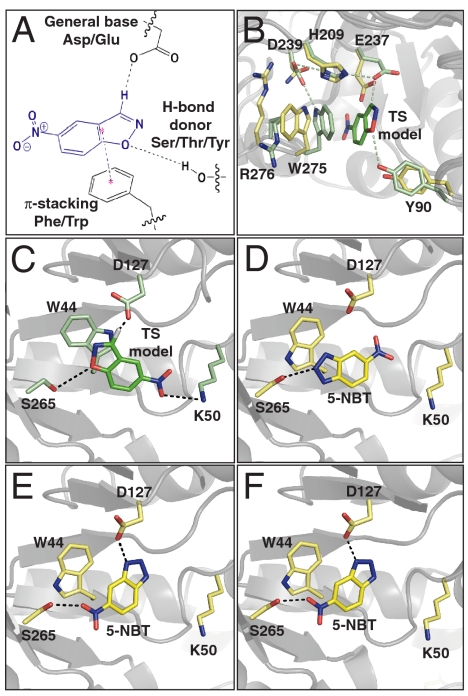
Fig. 2.
KE enzyme design models and crystal structures. (A) KE idealized active site. (B) Overlay of HG-1 crystal structure active site residues (yellow) with design model (green). (C) The HG-2 design model. (D) and (E) Crystal structure of HG-2 active site, chain A. The two conformations of the TSA 5-NBT are shown separately for clarity. (F) Crystal structure of HG-2 active site, chain B with the single observed conformation of the TSA.

