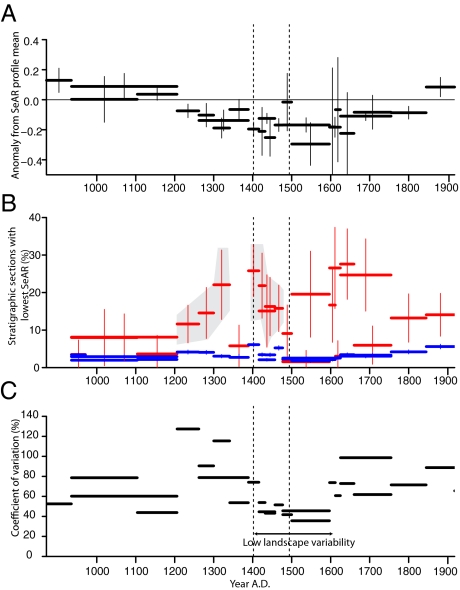
Fig. 4.
Broken vertical lines indicate the dates of the two plagues. The deviation in SeAR for each time period from the profile mean (as opposed to the regional mean) is shown in A. B shows the percentage of profiles that recorded the lowest or second lowest SeAR since settlement of Iceland in A.D. ∼870 (n ≥ 40). The red bars indicate the percentage and 95% confidence intervals, whereas the blue bars indicate the expected random percentage based on the proportion of age periods as a proportion of total age periods identified, with 95% confidence intervals indicated. Areas shaded in gray show where all of the age periods have significantly more low SeAR rates than could be expected by chance. C shows the coefficient of variation (percent variance of SD of mean), which indicates low variability from A.D. 1416 to A.D. 1597.

