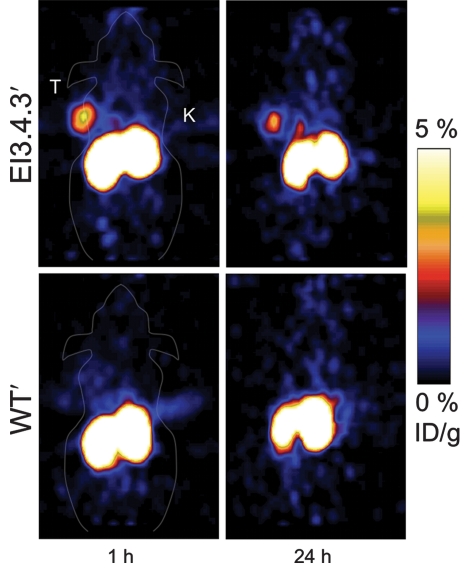
Figure 3a:
Micro-PET imaging data. A431 epidermoid carcinoma cells were xenografted into nude mice. Approximately 1.8 MBq 64Cu-Fn was injected in the tail vein. Five-minute static scans were performed at 1 and 24 hours after injection. (a) Coronal sections. K = kidneys. T = tumor. (b) Graphs show signals in the tumor, kidneys, and hind leg muscle quantified with software (AsiPro VM). Value and error bars = mean and standard deviation (n = 5 for EI3.4.39, n = 3 for WT9). * = P < .05, ** = P < .005.

