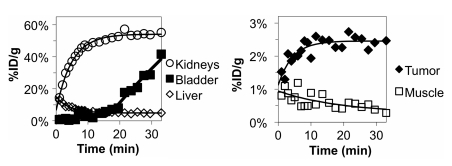
Figure 7:
Graphs show dynamic micro-PET imaging results. A 35-minute dynamic scan was performed with micro-PET. Mean signals in ellipsoid regions of interest were quantified with software. Theoretical curves were fit assuming exponential kinetics (including a lag phase for bladder uptake). Data are from a single mouse experiment representative of triplicate experiments.

