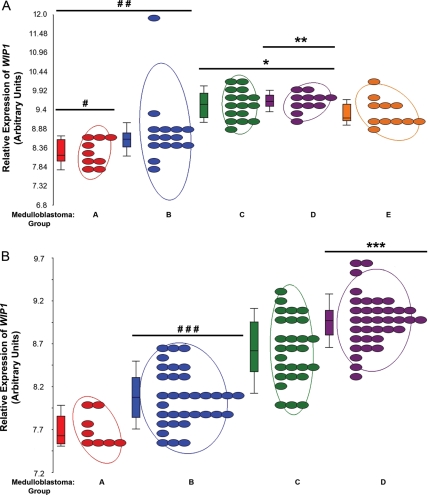
Fig. 1.
Group C and D human medulloblastomas express WIP1 at high levels. (A) WIP1 expression in medulloblastomas from group A versus groups B-E (#P = 3.8 × 10⁻⁵) in the Kool et al. dataset (GEO GSE10327). WIP1 expression was also lower in groups A and B than in groups C–E (##P = 3.7 × 10⁻⁷). Conversely, WIP1 expression was higher in groups C and D than in other groups (*P = 1.7 × 10⁻⁵). WIP1 expression was also higher in group D than in group C (**P = .012). (B) In the Northcott et al. dataset (GEO GSE21140), WIP1 expression was lower in the SHH-pathway activated group than in other groups (###P = 2.9 × 10⁻⁵). Conversely, WIP1 expression was higher in group D than in other groups (***P = 4.7 × 10⁻¹⁸). Each colored oval denotes expression in an individual tumor sample. Adjacent boxes represent first, second, and third quantiles of data. The middle line in each box represents the median value for each group. Whiskers represent the bottom 10th and top 90th percentiles for each group. Values on the Y-axis denote relative expression after raw expression values were quantile-normalized and log2 transformed. All P values were false discovery rate corrected.

