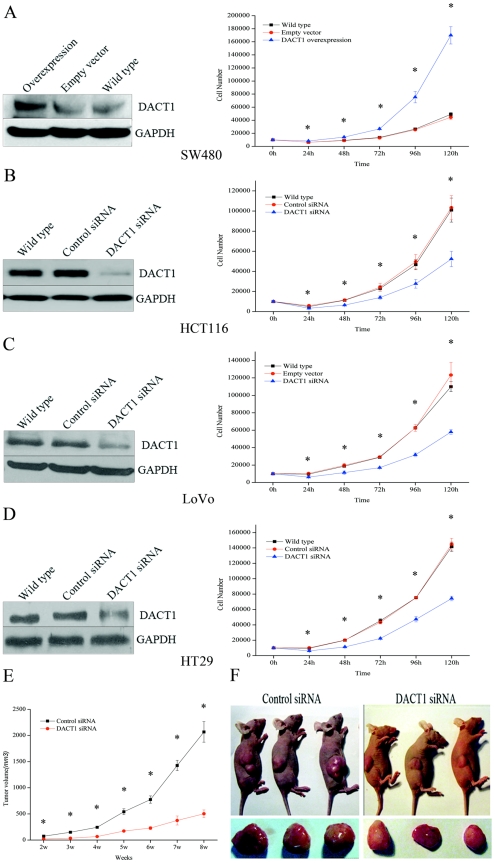
Figure 2. DACT1 enhances cellular proliferation and colon tumorigenesis.
(A) Left: overexpression of DACT1 in stably transfected SW480 cells. Right: growth curve proliferation assay in DACT1-transfected SW480 cells (mean ± SEM; n = 3, *p<0.05 versus empty vector-transfected cells). (B, C, D) Left: DACT1 expression in wild-type, control siRNA-transfected, and DACT1 siRNA-transfected HCT116, LoVo and HT29 cells. Right: growth curve assays in DACT1 siRNA-transfected HCT116, LoVo and HT29 cells (mean ± SEM; n = 3, *p<0.05 versus wild-type cells). (E) Average tumor volume assessed weekly after the injection of animals with control siRNA-or DACT1 siRNA-transfected HCT116 cells (mean ± SEM; n = 3, *p<0.05). (F) Representative pictures eight weeks after injection of mouse colon cancer cells with control siRNA or DACT1 siRNA-transfected HCT116 cells.

