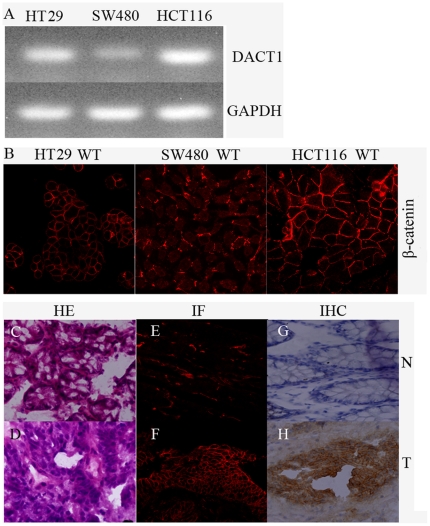
Figure 7. Correlation between DACT1 levels and membrane-associated β-catenin expression in colon cell lines and colon cancer tissue.
(A) Semiquantitative RT-PCR analysis of DACT1 expression in HCT116, HT29 and SW480 cells. GAPDH was used as the control. (B) Immunofluorescence analysis of DACT1 and β-catenin expression in HCT116, HT29 and SW480 cells. Original magnification, 40×. (C, D) HE staining of samples of normal human colon mucosa (N) and adenocarcinoma (T) tissues by an anti-β-catenin antibody. Original magnification, 40×. (E, F) immunofluorescence (IF) staining of samples of normal human colon mucosa (N) and adenocarcinoma (T) tissues by an anti-β-catenin antibody. Original magnification, 40×. (G, H) Immunohistochemical (IHC) staining of samples of normal human colon mucosa (N) and adenocarcinoma (T) tissues by an anti-β-catenin antibody. Original magnification, 40×.

