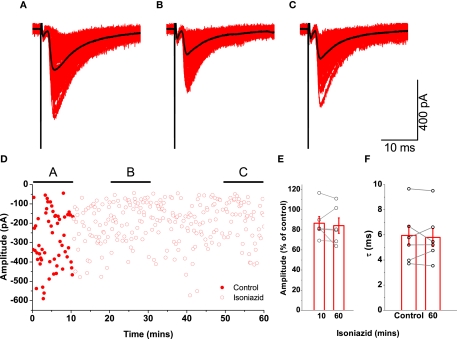
Figure 7.
Effects on glycinergic IPSCs by application of 20 mM isoniazid were not compatible with vesicular GABA depletion. The traces illustrate an example of a recording of post-synaptic responses during the control period [trace (A)] and two epochs following isoniazid superfusion [traces (B) and (C)]. Mean responses are overlayed in black. Graph (D) plots the changes in amplitude, illustrating the time periods corresponding to (A–C), and shows a modest but rapid reduction in current. The group data for all motoneurons shows that the attenuation of evoked IPSCs [graph (E)] after 1 h was no greater than that observed after ∼10 min, and that isoniazid superfusion had no systematic effect on the decay time constant [graph (F)].

