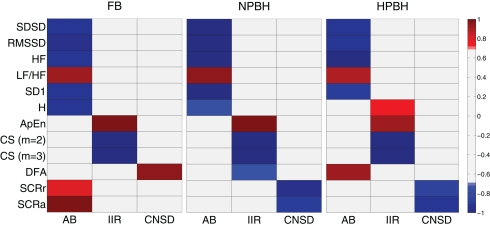
Figure 4.
Factor analysis loading maps for the three condition (FB, NPBH, and HPBH). For each condition is shown the loading set associated to the three factors (AB, IIR, and CNSD) and related to each feature. The threshold for the absolute values of the loadings was set to 0.7, the loading values below 0.7 was in gray. All the abbreviations are described in the text.

