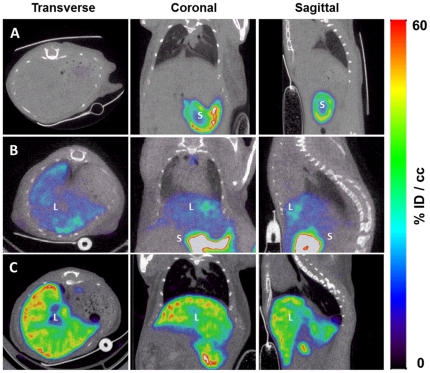
Figure 1. Imaging of NIS expression by microSPECT-CT.
Transverse, coronal and sagittal slices from SPECT images of Balb/c mice intravenously injected with (A) saline buffer (n = 4), (B) 5×10⁸ PFU (n = 3) or (C) 1×10⁹ PFU Ad-CMV-rNIS (n = 3). Forty-eight hours later, mice received an intraperitoneal injection of 100 MBq 99mTcO4- and were imaged with a microSPECT-CT camera (eXplore speCZT, General Electric). (S) stomach and (L) liver.

