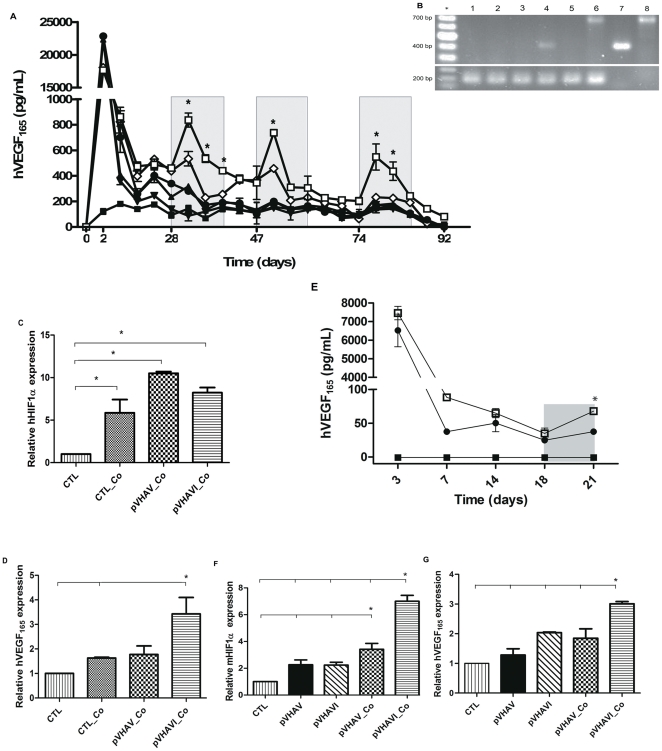
Figure 2. Assessment of VEGF expression vectors.
(A) hVEGF165 production under hypoxia and normoxia in HEK293 cells. On days 28, 47 and 74, CoCl2 was added to a final concentration of 100 µM, and the medium was replaced every 3 days with fresh medium containing CoCl2 for 9 days (gray bars). -▪- no transfection; -▴- pVV; -▾- pVAV; -◊- pVAVI; -•- pVHAV; -□- pVHAVI. * p<0.001, pVHAVI in comparison to all groups. (B) Genomic DNA PCR after 4 weeks of transfection. 1: no transfection; 2: pVV; 3: pVAV; 4: pVAVI; 5: pVHAV; 6: pVHAVI; 7: pVAX-attB-hVEGF165 (432 bp); 8: pVAX-HRE-attB-hVEGF165 (725 bp). The 200 bp band is from GAPDH. * 100 bp ladder. pVV: pVAX-hVEGF165 + pVAX; pVAV: pVAX-attB-hVEGF165 + p-INT; pVAVI: pVAX-attB-hVEGF165 + uP-INT; pVHAV: pVAX-HRE-attB-hVEGF165 + p-INT pVHAVI: pVAX-HRE-attB-hVEGF165 + uP-INT (C) HIF1α and (D) hVEGF165 expression in HEK293 cells. On day 15 the HEK293 cells from the experiment (A) were collected for analysis by qRT-PCR. CTL: control; Co: CoCl2 ; * p<0.05. (E) hVEGF165 production under hypoxia and normoxia in C2C12 cells. On day 18 CoCl2 was added to a final concentration of 100 µM and 3 days later the medium was collected for VEGF quantification by ELISA. -▪- no transfection; -•- pVHAV; -□- pVHAVI. * p<0.05. (F) HIF1α and (G) hVEGF165 expression in C2C12 cells. On day 15 the C2C12 cells from the experiment (C) were collected for analysis by qRT-PCR. CTL: control; Co: CoCl2 ; * p<0.05 of pVHAVI_Co group versus all other groups.

