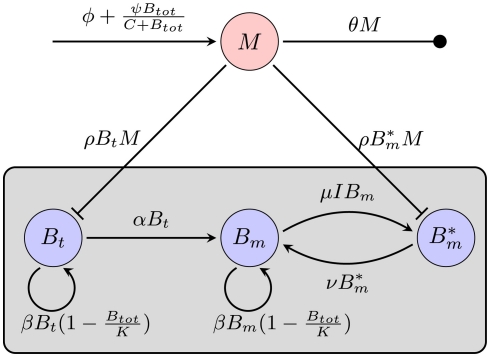
Figure 5.
Model of the bacterial dynamics at the infection site with molecular adaptations of the pathogen and a simple representation of the adaptive immunity. Vulnerable BB Bt enter the infection site and adapt at a rate α to a state where they are not recognized by phagocytes anymore. These adapted bacteria (Bm) can be bound by antibody I (not shown), making them susceptible again. Bt: phagocytosis-susceptible bacteria, Bm: adapted bacteria, : antibody-bound bacteria, beta: bacterial replication rate, K: carrying capacity, ρ: phagocytosis rate, ɸ: physiological phagocyte migration into infection site, ψ: phagocyte recruitment as infection response, C: bacterial concentration yielding half-maximal recruitment of phagocytes, θ: phagocyte death rate, α: bacterial adaptation rate (transition to resistant state), μ: antibody binding rate, ν antibody dissociation rate, I antibody concentration.

