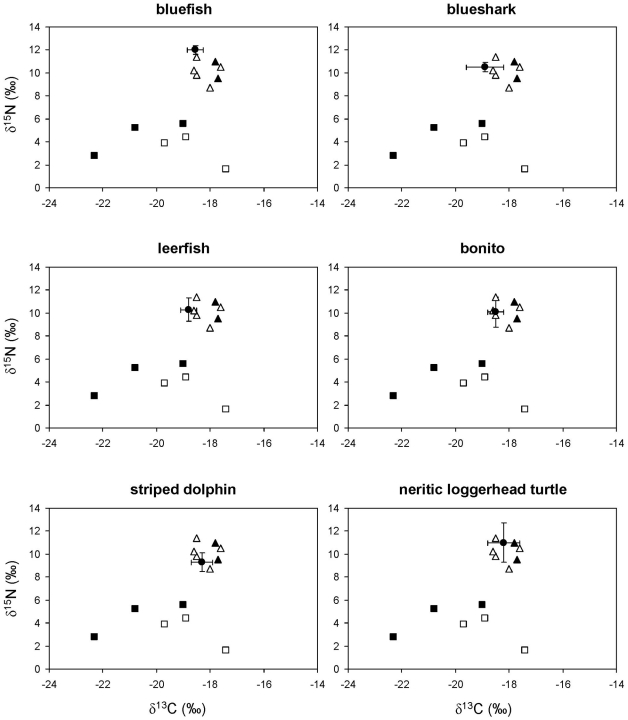
Figure 2. Stable isotope ratios of bluefish, blueshark, leerfish, bonito, striped dolphins and neritic loggerhead sea turtles from the northwestern Mediterranean.
Solid circles represent the average stable isotope ratios of each consumer after correcting for diet-tissue isotopic discrimination and error bars show standard deviation. Other symbols show the average stable isotope ratios of potential prey: pelagic crustaceans (solid squares), gelatinous plankton (empty squares), squid (solid triangles) and small pelagic and mesopelagic fish (empty triangles).

