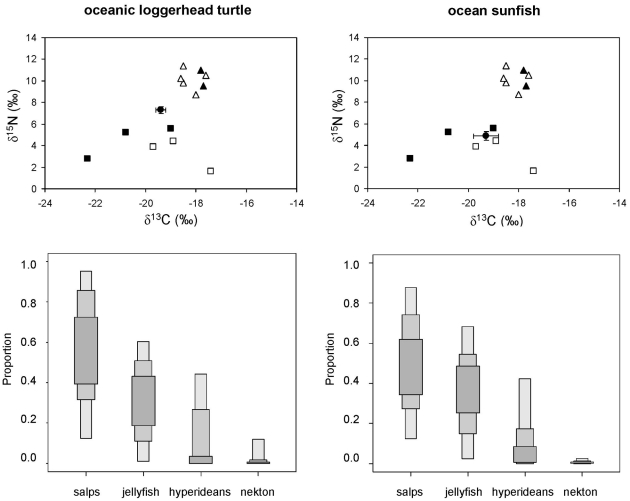
Figure 6. Stable isotope ratios of oceanic loggerhead sea turtle and ocean sunfish from the northwestern Mediterranean and feasible contribution of potential prey to their diet according to SIAR.
Solid circles represent the average stable isotope ratios of each consumer after correcting for diet-tissue isotopic discrimination and error bars show standard deviation. Other symbols show the average stable isotope ratios of potential prey: pelagic crustaceans (solid squares), gelatinous plankton (empty squares), squid (solid triangles) and small pelagic and mesopelagic fish (empty triangles). Nekton: anchovy, lanternfish, horse mackerel and shortfin squid. Results are shown as 95, 75 and 25% credibility intervals for each prey.

