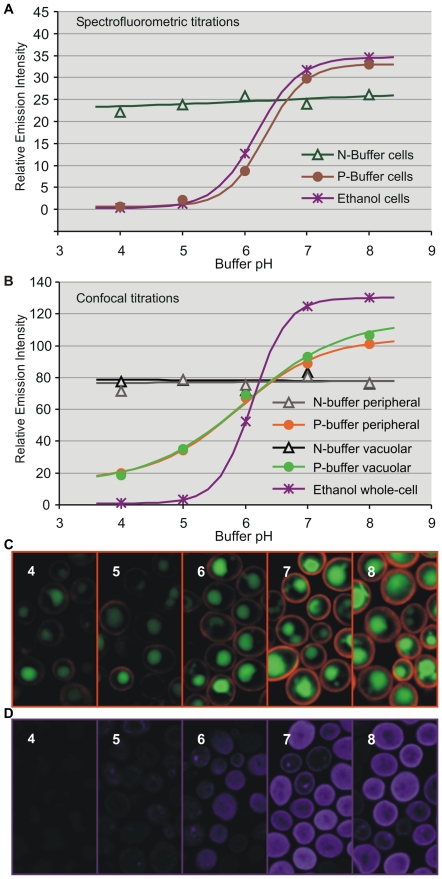
Figure 1. Spectrofluorometer and confocal intensity titrations.
Emission intensity (unitless) versus pH titration curves from Ato1p-yEGFP1 fresh cells (A) or individual organelles within fresh cells (B) suspended in N or P-buffers of pH 4–8. Spectrofluorometric analyses and confocal scans were respectively completed within 5 and 3 min after buffer suspension. Treatments with high-dose ethanol (60%) for 2 min before N-buffer suspension were included as invasive controls. Examination of the titration curves (A and B) implied a connection between the sigmoid slope and the degree of cell permeation, but only confocal titration curves (B) evidenced the altered response of ethanol-treated cells. Fluorescent signal for the confocal titrations was acquired from discrete ROIs in the confocal stacks (C and D). Confocal stack images of P-buffer cells with peripheral and vacuolar ROIs (C). Confocal stack images of ethanol-treated cells with whole-cell ROIs (D) revealing the effects of high ethanol doses on cell and organelle integrity. Images were digitally colored to depict ROI sampling.

