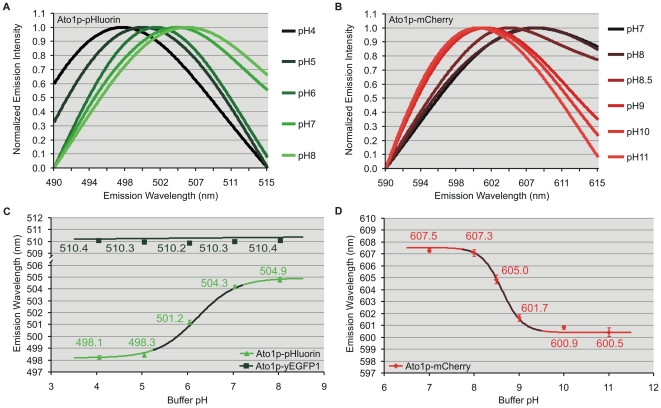
Figure 2. Confocal wavelength titrations.
Emission spectra (nm) at different pH from peripheral ROIs within Ato1p-pHluorin (A) and Ato1p-mCherry (B) yeast cells suspended in P-buffers of pH 4–11. Emission intensities were normalized to better show peak shifts. Emission wavelength versus pH titration curves from Ato1p-pHluorin (C) or Ato1p-mCherry (D) peripheral ROIs. Both fluorophores exhibited pH-dependent wavelength shifts indicative of ratiometry by emission at the given pH ranges. Ecliptic yEGFP1 maintained a constant wavelength as expected (C). Representative values were averaged from independent subsets of 10 cells with 20 subcellular ROIs each. Error bars indicate the standard error. The darker areas within the sigmoidal titration curves represent their quantitation limits.

