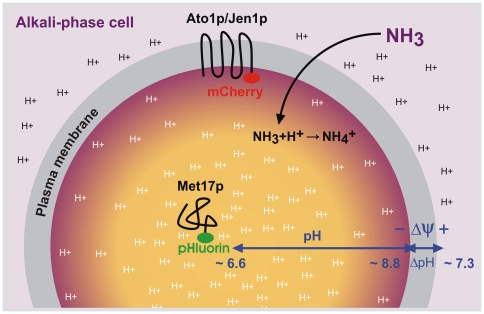
Figure 6. Model of cellular pH gradients.
Schematic diagram illustrating intracellular pH gradients within yeast cells from alkali-phase colonies. Measurements with Ato1p-pHluorin, Ato1p-mCherry, Jen1p-mCherry and Met17p-pHluorin fusion proteins provided evidence for the existence of sharp intracellular pH gradients between peripheral (∼8.8) and internal (∼6.6) cytoplasmic regions during the ammonia-producing alkali phase. In contrast to protonated ammonium (NH4 +), volatile ammonia (NH3) enters the cell by simple diffusion through the plasma membrane. High cytosolic pH values near the plasma membrane allow for the maintenance of high transmembrane electrochemical potential (Δψ) based on H+ gradient (ΔpH) under conditions of relatively high extracellular pH (∼7.3).

