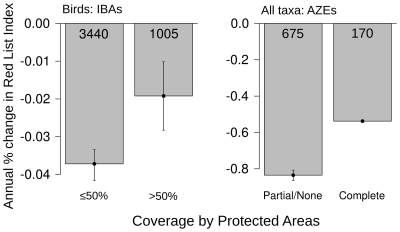
Figure 1. Annual percentage decline in Red List Index for sets of bird species (during 1988–2008) with ≤50% or >50% of IBAs completely protected, and for bird (1988–2008), mammal (1996–2008) and amphibian species (1980–2004) restricted to single sites (AZEs) that are partially/unprotected versus completely protected (averaged across taxa, weighting species equally).
Numbers within each bar refer to the number of species. Error bars show 95% confidence intervals based on uncertainty around the estimated value that is introduced by Data Deficient species.

