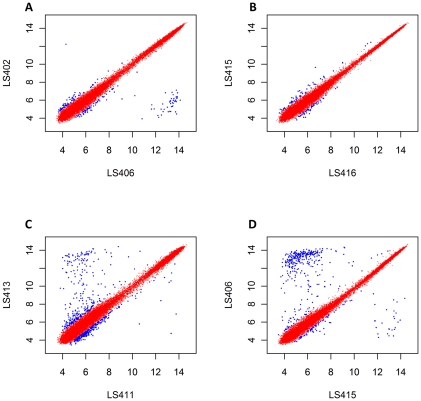
Figure 4. Comparison of the summarized Robust Multi-array Averaging (RMA) intensities by scatter plots.
Between strains from the same epidemic clones (ECIV) and pathotypes; FG, LS402 and LS406 (A) and Inv; LS415 and LS416 (B). Between strains from the same epidemic clones (ECI) and pathotype (Inv), different outbreaks; LS411 and LS413 (C). Between strains from the same epidemic clones (ECIV), different pathotype; Inv, LS415 and FG, LS406 (D). Red dots indicate summarized RMA intensity differences of less than or equal to 2-fold between two strains. Blue dots indicate RMA intensity differences of more than 2-fold between two strains.

