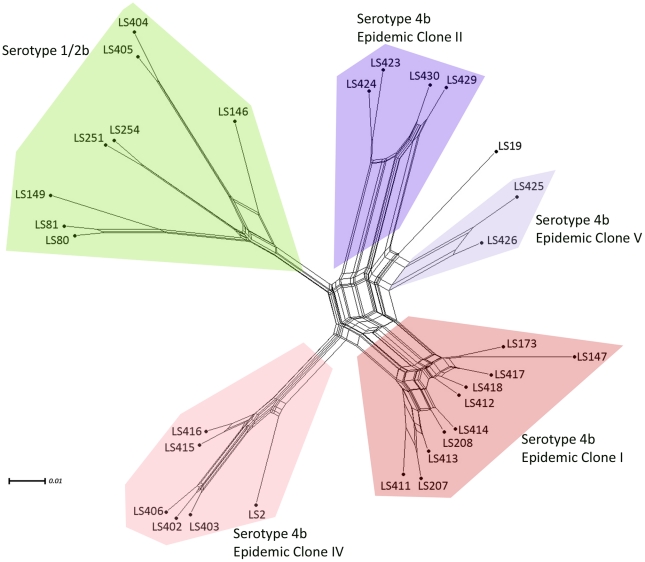
Figure 7. A neighbor-net constructed from the gene contents from 31 strains belonging to the two serotypes 1/2b and 4b.
The parallel edges represent incompatible signals indicative of independent gene loss or gain due to the multiple transductions or recombinations. Serotypes and epidemic clones are grouped in different color as indicated. Node labels refer to strain names (Listed in Table S1). Scale bar represents number of gene differences (present or absent) per gene site.

